Category: Generally
Greece’s innovation performance as reflected in the European Innovation Scoreboard 2018
06.07.2018
Greece’s innovation performance is constantly improving, based on the latest findings of the European Innovation Scoreboard 2018 (EIS) regarding the composite innovation index from 2014 to date. A similar improvement is also recorded in individual dimensions of innovation and research & development, with the country converging towards the European average.
This conclusion is drawn from the analysis of the EIS data for Greece carried out by the National Documentation Centre (EKT). The analysis is intended to facilitate the understanding of the complex primary synthesis tables concerning the country (as published in the corresponding country report for Greece) and the subsequent enhancement of the relevant public debate.
The European Innovation Scoreboard (EIS) 2018, published on 22 June by the European Commission, presents the relative performance of Member States for 2017, taking into account 27 different indicators. Through the annual publication of the EIS since 2000 to date, it provides a comparative assessment of the research and innovation performance of European Member States (and some third countries), highlighting the strong and weak dimensions of their research and innovation systems. In addition, the publication of the findings encourages Member States to prioritise and/or prioritise the areas where they should focus their efforts to further improve this performance.
According to the 2018 findings, Europe’s overall innovation performance continues to improve, and the pace of this improvement has accelerated in recent years. As a result, the EU is closing the gap between itself and key competitors such as Canada, Japan and the United States. But further efforts are needed to ensure global competitiveness. At Member State level, Sweden is once again in first place, followed by Denmark, Finland, the Netherlands, the Netherlands, the United Kingdom and Luxembourg, which this year joins the group of innovation leaders.
The position of Greece
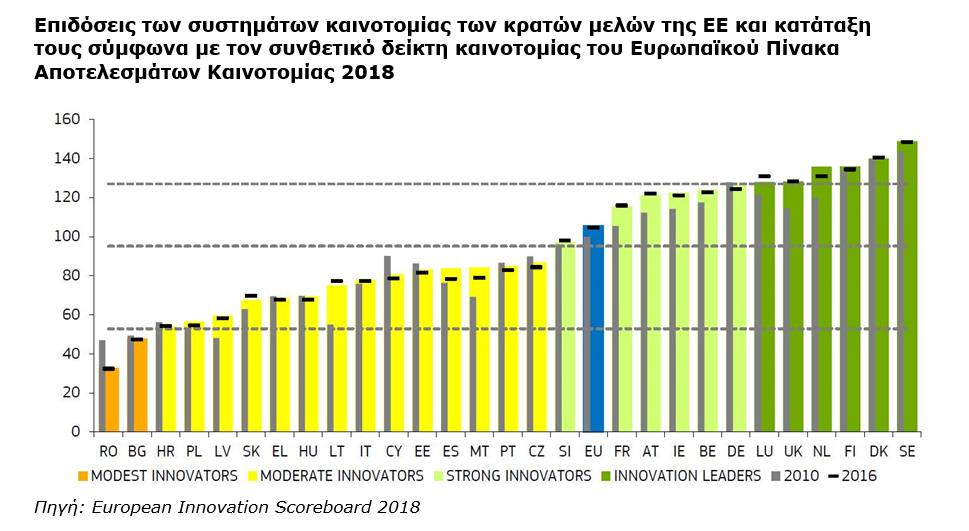
Taking into account that Member States are categorized into four categories and ranked according to a composite innovation index (Summary Innovation Index), Greece is ranked in the group of countries with “Moderate innovation performance” based on its overall performance across the full range of EIS indicators of research, innovation, human capital, structure of the economy, entrepreneurship, ranking 22nd. It should be noted that this is the category in which the country has been ranked over time.
Overall and in relation to the European average (2010: 100), Greece shows a continuously improving trend starting from 2014 to the most recent year (2017), with the composite innovation index increasing from 62 to 69 basis points.
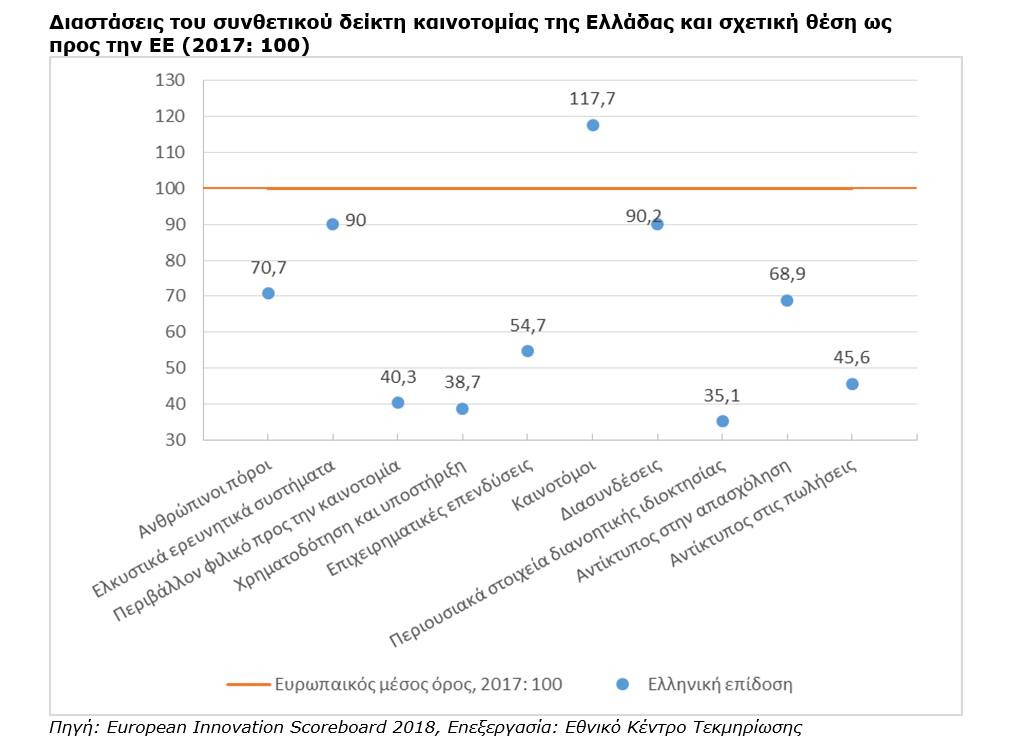
More specifically, the dimensions of the composite innovation index in which the country is presented as “strongest” are “attractive research systems”, “innovative” and “interconnections”. In the case of ‘innovative’, the country outperforms the European average by 17.7 basis points (Greece: 117.7 – EU 2017: 100). In the case of ‘attractive research systems’ and ‘interconnections’, the country’s performance is only 10 basis points below the EU average (Greece: 90.0 and 90.2 – EU 2017: 100). It is worth noting that in the indicator ‘population with higher education’, an indicator included in the ‘human resources’ dimension, the country’s performance also exceeds the EU average by 23 basis points.
The dimensions where the country is significantly below the EU average are “funding and support” and “intellectual property assets”. Here, the country falls short by 61.3 and 64.9 basis points, respectively (Greece: 38.7 and 35.1; EU 2017: 100). Also, a lag compared to the EU average is recorded in the dimensions “innovation-friendly environment” (40.3), “impact on sales” (45.6) and “business investment” (54.7).
Focusing on Innovation
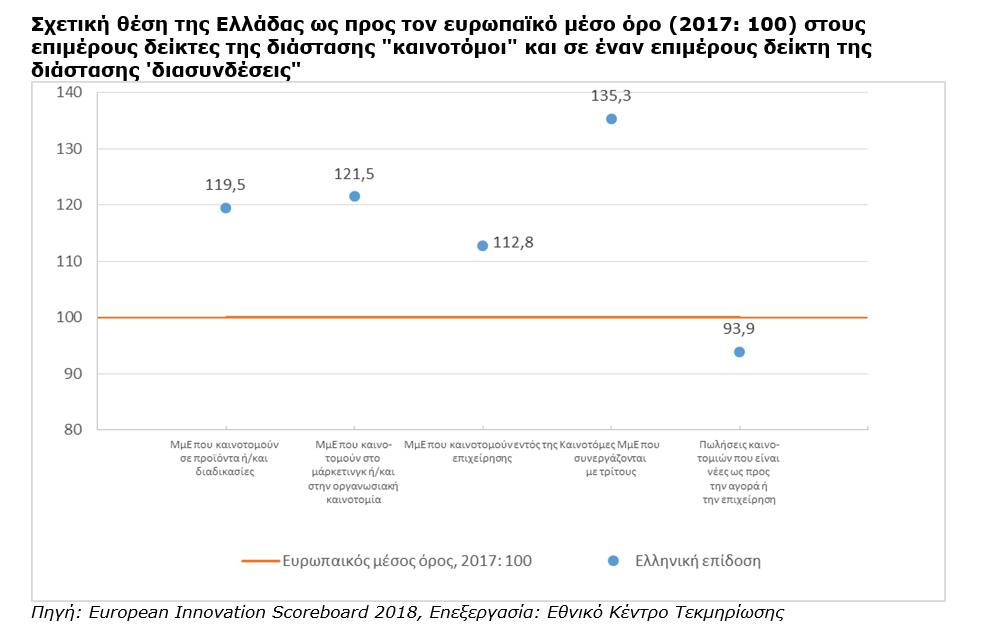
The country’s very high performance in the innovation dimension (the “innovators” dimension) corresponds to equally high performance in all the individual indicators that make up the innovation dimension. More specifically, in the indicator concerning SMEs innovating in products and/or processes, in the indicator concerning SMEs innovating in marketing and/or organisational innovation, as well as in those SMEs innovating within the enterprise, performance exceeds the EU average by 19.5, 21.5 and 12.8 basis points, respectively. In fact, for the indicator on innovative SMEs working with third parties (which is included in the dimension ‘linkages’), the country’s performance exceeds the EU average by 35.3 basis points. The only case where domestic innovation performance lags behind the EU is ‘sales of innovations that are new to the market or firm’, an indicator that is taken into account for the ‘sales impact’ dimension. However, the gap is only 6.1 basis points.
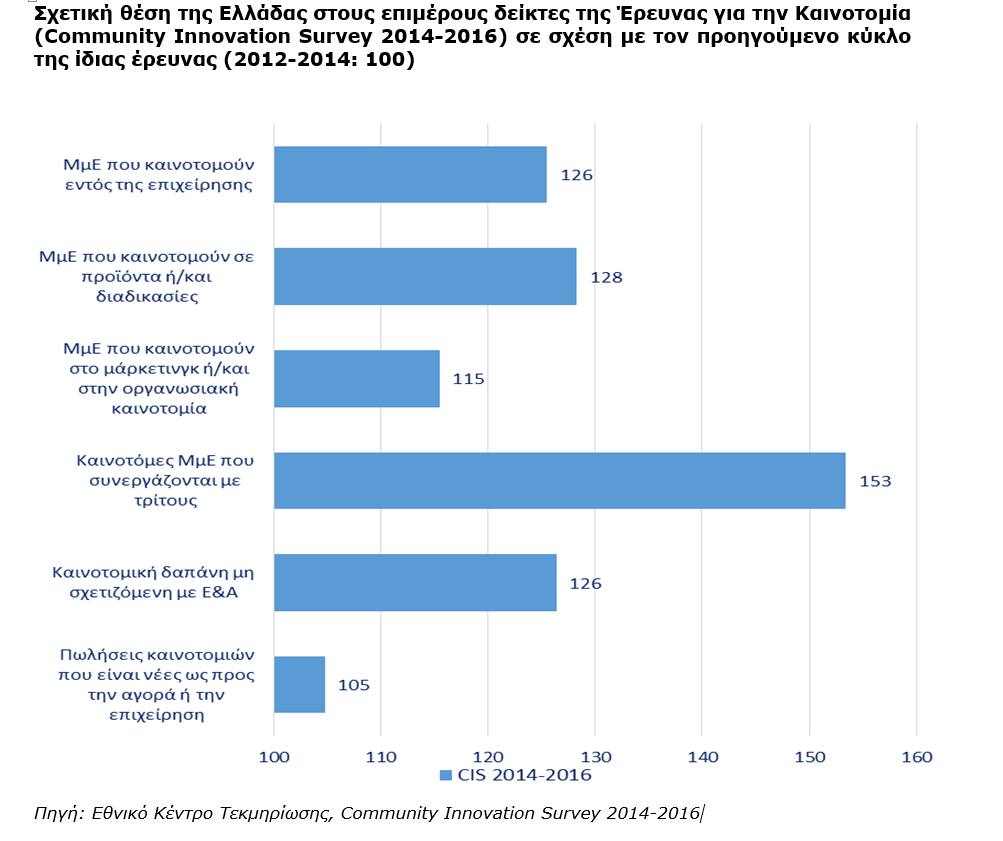
Beyond the comparison with the EU average, it is valuable to record the country’s innovation performance over time. In particular, the comparison should relate the current performance to the performance recorded in the previous cycle of the Community Innovation Survey, the survey from which the relevant indicators are derived for inclusion in the EIS.
According to the findings, the current innovation performance of firms has improved in all six sub-indicators compared to the 2014 results. Indicatively, the increase in the indicator “innovative enterprises collaborating with third parties” is of the order of 53 basis points, while the increase in the indicator “SMEs innovating in products or processes” is of the order of 28 basis points.
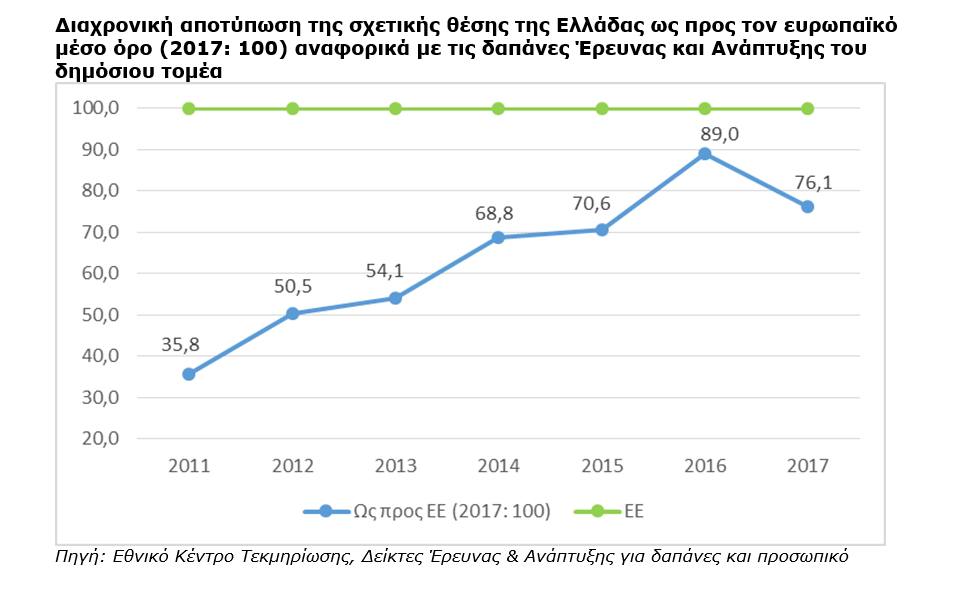
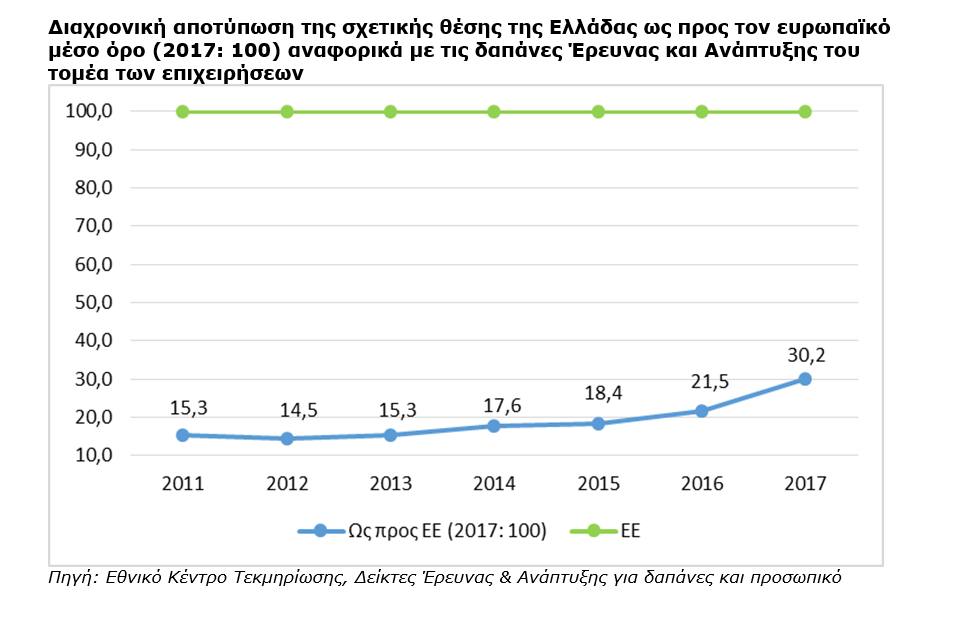
Focusing on the funding of Research & Development Development
It is interesting to note that the data on the funding of Research & Development activities in the field of research and development are not yet available. Development activities by the public sector and enterprises, as reflected in the recent edition of the EIS. Presenting the longitudinal data (from 2011 to date) for both cases shows a continuous increase towards convergence with the European average, with a small exception for public sector spending between 2016-2017 compared to the EU average for the year 2017.
EKT’s contribution to the European Innovation Scoreboard
Since 2012, with the assumption of responsibility for the collection and publication of national Research, Technology, Development and Innovation (RTDI) statistics, EKT has been contributing to the formulation of the innovation indicators presented in the European Innovation Scoreboard (EIS). The ESF sends to the EIS the data derived from the Community Innovation Survey, concerning 6 indicators (“Non R&D innovation expenditures”, “SMEs innovating in-house”, “Innovative SMEs collaborating with others”, “SMEs product/process innovations”, “SMEs marketing/organisational innovations” and “Sales of new-to-market/firm innovations”), and from the survey on Research & Development activities and the Community Innovation Survey. R&D activities in all sectors of the economy, the data concerning 2 indicators (“Public R&D Expenditures” and “Business R&D Expenditures”).
It should be noted that the present analysis does not present the data concerning the country’s relative position with respect to the EU’s 2010 average, since the 2010 data concerning our country are not official measurements but calculations and reductions based on the latest measured data, for the period 2004-2006 for innovation and 2005 for research and development.
Statistics and indicators on Research, Development and Innovation in Greece, produced and published by EKT, are sent on a regular basis to Eurostat and the OECD. The analysis of the data and the relevant indicators are published in ECB print and electronic publications available on http://metrics.ekt.gr.
